Oops!
3/3/2021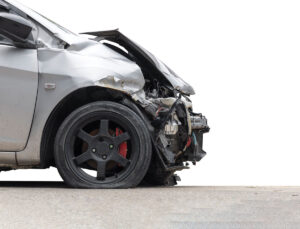 On Sept. 29, 1905, F. D. Harriman, an attorney from Hampton, lost control of his vehicle, hit a bridge and crashed into a ditch. Tragically, Harriman died as a result, and he became the state’s first car-related fatality on historical record.
Des Moines doesn’t have a middle name. If it did, most likely, it wouldn’t be “danger.” But danger does exist when we get behind the wheel, and more than two-thirds of Iowa’s population is licensed to drive. As such, CITYVIEW perused state records to identify the local places where the most accidents happen and to report other items of interest regarding automoblile outcomes.
Caution… HONK! HONK! Watchout! Hold your horses? Start your engines… Oops. And away we go.
Intersections with the most injurious crashes (2014-2018)
Intersections with the highest number of injurious crashes (fatalities, suspected serious injuries, and suspected minor injuries).
Note that these are listed by crash frequency at all intersection types regardless of traffic volumes, configuration or traffic control.
| STATE OF IOWA 17 — Ankeny: U.S. 69 and W. First Street & E. First Street 16 — Des Moines: Keo 19th Street N.E. Exit Ramp at 19th Street 14 — Cedar Falls: IA 27 at Viking Road |
POLK COUNTY 17 — Ankeny: U.S. 69 at W. First Street and E. First Street 16 — Des Moines: KEO 19th Street N.E. Exit Ramp at 19th Street 13 — Des Moines: Sixth Avenue, N. at Day Street, W. 13 — Des Moines: U.S. 69/S.E. 14th Street at Maury Street |
DALLAS COUNTY 7 — West Des Moines: Vista Drive at 60th Street 6 — Clive: U.S. 6 at S.E. Waco Place 6 — Adel: U.S. 6 at R Avenue 6 — West Des Moines: Boone Drive at University Avenue and 92nd Street |
| DES MOINES 16 — KEO 19th Street N.E. Exit Ramp at 19th Street 13 — Sixth Avenue, N. at Day Street, W. 13 — U.S. 69/S.E. 14th Street at Maury Street |
WEST DES MOINES 7 — Vista Drive at 60th Street 7 — Westown Parkway at 22nd Street 6 — Boone Drive at University Avenue & 92nd Street |
ANKENY 17 — U.S. 69 at W. First Street and E. First Street 10 — U.S. 69 at S.W. Third Street & S.E. Third Street 9 — IA 415 at IA 160 9 — U.S. 69 at S.E. Magazine Road |
| URBANDALE 6 — U.S. 6 at N.W. 86th Street 4 — I-35 S.E. Ramp Curve at N.W. Urbandale Drive 4 — Meredith Drive at 67th Street 4 — Douglas Avenue at Mary Lynn Drive 4 — Meredith Drive at N.W. Urbandale Drive 4 — Parkview Drive at Meredith Drive |
WAUKEE 2 — Waukee: U.S. 6 at Warrior Lane 1 — U.S. 6 at N.E. Dartmoor Drive 1 — U.S. 6 at Carefree Lane 1 — University Avenue at S.E. Brick Drive 1 — University Avenue at Ashworth Drive and S.E. LA Grant Parkway 1 — Laurel Street at Carefree Lane 1 — U.S. 6 at Peachtree Drive 1 — I-80 at Co Road R22/UTE Avenue 1 — U.S. 6 at Alices Road 1 — U.S. 6 at 10th Street |
JOHNSTON 4 — N.W. 62nd Avenue at N.W. 106th Street 3 — N.W. 70th Avenue at Northglenn Drive 2 — N.W. Newport Vista Drive at N.W. 100 Street 2 — N.W. 62nd Avenue at N.W. Beaver Drive 2 — Birchwood Court/Northpark Drive at 86th Street 2 — N.W. 62nd Avenue at N.W. 97th Street 2 — Northglenn Drive at Merle Hay Road 2 — N.W. 60th Avenue at Merle Hay Road 2 — N.W. Beaver Drive & 66th Avenue at N.W. Beaver Drive & 66th Avenue
|
According to current Iowa records, 47,722 car crashes were reported statewide in 2020. If that number, or something close to it, holds and becomes official, it would mark a significant decrease from the numbers reported in recent years. Unfortunately, last year’s fatality numbers stayed consistent despite the decrease in reported accidents. The Iowa
DOT generally makes the previous year’s records official on April 15 of the following year.
47,722 Total Crashes in 2020 (unofficial) — Fatalities: 338
58,554 Total Crashes in 2019 — Fatalities: 336
56,898 Total Crashes in 2018 — Fatalities: 319
56,000 Total Crashes in 2017 — Fatalities: 331
DEATHS ON THE DECLINE SINCE 1970
Iowa’s fatality rate has hovered around one per 100-million vehicle miles traveled for the past few years, meaning one death occurs for every 100-million miles traveled in a vehicle in Iowa. This number has been trending down since 1970 when Iowa recorded 912 fatalities at a rate of 5.68 deaths per 100-million vehicle miles traveled.
Source: iowadot.gov/mvd/stats/crashhistory.pdf
~1 deaths per 100-million vehicle miles traveled in Iowa (currently)
5.68 deaths per 100-million vehicle miles traveled in Iowa (1970)
336 — Iowa motor vehicle crash fatalities in 2019
912 — Iowa motor vehicle crash fatalities in 1970 (record high)
Source: iowadot.gov/mvd/stats/crashhistory.pdf
More than 2.3 million drivers are licensed to drive in Iowa. But in the last 10 years, Iowa has averaged less than one auto-crash-related death per day in Iowa (2011-2020).
Source: iowadot.gov/mvd/stats/licenseddrivers.pdf
340.9 — Average annual number of Iowa traffic fatalities in the previous 10 years (2011-2020).
3,409 — Total number of Iowa traffic fatalities in the previous 10 years (2011-2020).
Source: Iowa DOT: icat.iowadot.gov/#
INTERSECTIONS
More than 20 percent of all auto-related fatalities nationwide occur at intersections.
Source: ctre.iastate.edu/research-synthesis/intersections
30 percent of Iowa’s severe crashes happen at an intersection.
Source: Iowa DOT. Iowa Strategic Highway Safety Plan: July 1, 2013-Dec. 31, 2016. Iowa Department of Transportation, 2013. www.iowadot.gov/traffic/shsp/pdf/SHSP.pdf.
SUBURBS OFFER SAFER DRIVING?
Based on the number of accidents on a per-person basis, or on a vehicle-miles-driven basis, accidents happen at a higher rate within the boundaries of Des Moines proper than in central Iowa’s five biggest suburbs — West Des Moines, Ankeny, Urbandale, Waukee and Johnston. When added together, the population of these five suburbs is roughly equivalent to Des Moines proper. During the previous five years (2016-2020), Des Moines has incurred 78 traffic fatalities compared to 29 by the Big 5. Disparities also exist when comparing the ratio of serious injuries or total crashes.
(See top chart)
Fatal crash rates per 100-million vehicle miles driven reinforce the statistics above.
(See bottom table)
| 2016-2020 Fatalities Serious Injuries Total Crashes Population Estimates Iowa 1,724 6,954 274,244 3,155,000 Polk County 154 808 52,248 490,161 Dallas County 24 126 5,997 93,453 Des Moines 78 461 28,279 214,237 Big 5 Suburbs 29 225 16,649 226,304 *West Des Moines 12 88 5,727 67,899 *Ankeny 11 78 5,414 67,355 *Urbandale 4 34 3,424 44,379 *Waukee 1 13 1,195 24,089 *Johnston 1 12 889 22,582 |
| 2015 2016 2017 2018 2019 Fatal Fatal Fatal Fatal Fatal Fatal Fatal Fatal Fatal Fatal Crashes Crash Crashes Crash Crashes Crash Crashes Crash Crashes Crash Rate Rate Rate Rate Rate State of Iowa 283 0.85 355 1.07 355 1.07 291 0.87 313 0.93 Polk County 19 0.45 27 0.64 24 0.56 24 0.57 34 0.80 Dallas County 4 0.54 3 0.39 2 0.25 5 0.64 3 0.38 Des Moines 15 1.06 17 1.19 12 0.83 9 0.64 15 1.07 West Des Moines 2 0.31 2 0.31 2 0.28 1 0.14 4 0.55 Ankeny 1 0.29 2 0.59 0 0 5 1.29 1 0.26 Urbandale 0 0 0 0 1 0.25 2 0.52 1 0.26 Waukee 0 0 0 0 0 0 1 0.25 0 0 Johnston 0 0 0 0 1 1.28 0 0 0 0 |
CRASHES INVOLVING PEDESTRIANS
The chart below lists the raw numbers of pedestrian-related traffic accidents in Iowa, including fatal, suspected serious, suspected minor, possible and unknown injuries.
| 2015 2016 2017 2018 2019 State of Iowa 545 592 484 485 434 Polk County 124 139 111 119 111 Dallas County 11 2 5 2 3 Des Moines 111 116 86 96 86 West Des Moines 9 3 11 11 5 Ankeny 2 7 4 8 3 Urbandale 3 2 5 1 4 Waukee 7 1 1 0 2 Johnston 1 0 1 2 0 |
93 PERCENT
Americans who ranked themselves “better than average” at driving. A Swedish psychologist, Ola Svenson, famously conducted a study where he asked college students to rank their own driving ability among their peers. An incredible 88 percent of the Americans ranked themselves in the top half when it came to driving safely, and 93 percent of the Americans ranked themselves “better than average” regarding their driving skill. Since only half of a given population can be above average, these results, which have since been duplicated with varying degrees of success, indicate that many of us overestimate our aptitude behind the wheel. This phenomenon has become known as the Dunning-Kruger Effect.
94 PERCENT
Number of auto accidents caused by a driver’s error, according to The National Highway Traffic Safety Administration (NHTSA) in a 2015 report. The critical reason — defined as the last event in the crash-causal chain — was assigned to the driver in 94 percent (±2.2%)† of the crashes reviewed.
Source: crashstats.nhtsa.dot.gov/Api/Public/ViewPublication/812115
WHO: AVERAGE AGE
40 years old — The average age of drivers involved in crashes on Iowa roads. (2015-2019)
45 years old — Average age of people who have died in crashes on Iowa roads. (2015-2019)
Source: Iowa Department of Transportation, Traffic and Safety Bureau
WHO: GENDER
Sorry, fellas. Statistically, males are more likely to be in fatal car crashes than females.
Female: 39 percent — Number of drivers involved in crashes on Iowa roads who are female (2015-2019).
Male: 50 percent — Number of drivers involved in crashes on Iowa roads who are male (2015-2019).
Unknown: 11 percent — Number of drivers involved in crashes on Iowa roads where the gender wasn’t reported or was unknown (2015-2019).
Source: Iowa Department of Transportation, Traffic and Safety Bureau
SPEEDING AND OTHER FACTORS
The potential for danger exists in many of the places noted in this story. But certain activities will transform your front seat into the most dangerous place on the road. Texting, drinking, no-seatbelt wearing… The following stats pertain to auto-related fatalities where the activity was noted by the officer as a contributing factor to the crash.
1 — Number of fatal Iowa crashes when “driving less than the posted speed limit” was listed as the cause (2016-2020).
97 with seatbelt, 98 without seatbelt — Number of Iowa traffic fatalities in 2020 where seatbelt usage could be determined and that did not involve pedestrians, motorcycles or people who aren’t required to wear seatbelts.
Source: iowadot.gov/mvd/stats/previous_daily.pdf
| Year Speeding/aggressive driving* Impaired Driving Distraction by Electronics**
2015 168 125 12 |
*Being arrested for an OWI can cost a person $10,000. In addition, many people go on to lose their license, car and job.
**Don’t drive distracted. It is dangerous and unlawful to read, write or send a text message while driving in Iowa.
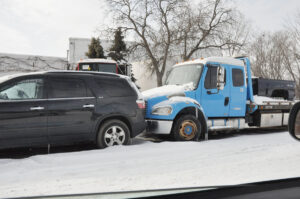
CRASHED ON THE FOURTH OF JULY
Automobiles — cars, trucks, etc.
On July 4, 2019, Iowa experienced:
112 crashes which involved
2 fatalities and
9 serious injuries
Over the four-day Fourth of July 2019 holiday period, Iowa experienced:
5 fatalities
3 fatalities involving alcohol
In the past five years, Iowa has only had one fatal car crash with “driving less than the posted speed limit” listed as the cause (2016-2020). Image by Gary Scott from Pixabay
On July 4, 2018, Iowa experienced:
105 crashes which involved
1 fatality and
2 serious injuries
Over the 1-day holiday period, Iowa experienced:
1 fatality and alcohol was involved
On July 4, 2017, Iowa experienced:
96 crashes which involved
2 serious injuries.
Over the four-day holiday period, Iowa experienced:
4 fatalities of which
1 involved alcohol
2020 stats are not yet confirmed.
The holiday period is determined as follows:
1 day if a holiday falls on a Wednesday
4 days if a holiday falls on a Tuesday or Thursday
3 days if the holiday falls on a Friday, Saturday, Sunday, or Monday
Source: Governor’s Traffic Safety Bureau, Iowa Department of Public Safety
| DID YOU HEAR? “Have you ever noticed? Anybody going slower than you is an idiot, and anyone going faster than you is a moron.” — George Carlin |
DID YOU KNOW? “In 1904, the speed limit in the business sections of Iowa towns and villages was ‘not to exceed one mile in six minutes.’ In the outer limits of towns the rate was ‘one mile in four minutes,’ and in the country districts, speed was limited to ‘20 miles per hour.’ ” Source: iowadot.gov/histbook.pdf; page 16 |
DID YOU KNOW? “In 1942, an Iowa constitutional amendment was adopted and the speed limit was defined as ‘reasonable and proper.’ ” Source: iowadot.gov/histbook.pdf; page 30 |
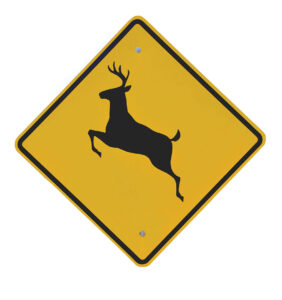 DEER IN THE HEADLIGHTS!
Number of total crashes with animals in Iowa, as reported to law enforcement, according to the Iowa Department of Transportation.
In all of 2019, there were 7,890 total crashes with animals that resulted in one fatality, 33 serious injuries and 140 minor injuries.
In 2018, there were 8,156 total crashes with animals that resulted in five fatalities, 29 serious injuries and 158 minor injuries. ♦